
Observability Stack on K3s: Grafana + Prometheus + Loki + Alloy

Cluster Provisioning and Alert Manager through Grafana
Your cluster is running, your pods are spinning, and you have absolutely no idea what’s happening inside. Welcome to the blind spot of self-hosting. The Grafana-Prometheus-Alloy-Loki stack is your escape from this darkness—a unified observability platform that collects metrics, aggregates logs, and screams at you before your users do.
Prometheus scrapes and stores time-series metrics from your nodes, pods, and applications. Loki does the same for logs, but without indexing the content (making it lightweight and cheap). Alloy acts as the collection agent, shipping logs from your pods to Loki. Grafana ties everything together with dashboards, queries, and alerting rules.
Alloy is Grafana's unified telemetry collector—the successor to Promtail, Grafana Agent, and a dozen other single-purpose collectors. Instead of running separate agents for logs, metrics, and traces, Alloy handles all three through a single binary with a declarative configuration language. It replaced Promtail in early 2024, so if you're following older tutorials that mention Promtail, Alloy is the modern equivalent with broader capabilities.
You absolutely could. Datadog, New Relic, Grafana Cloud—they all work beautifully. They also charge per host, per metric, per GB ingested, per alert, and occasionally per dream you had about Kubernetes. A modest 3-node cluster with reasonable log volume can easily cost $200-500/month in managed observability. This stack? Zero. The only cost is your time and the compute resources you're already paying for.
This stack takes 30 minutes to deploy and a lifetime to maintain. ZipOps clusters ship with Prometheus, Loki, and Grafana pre-configured—same stack, zero YAML. If observability is a means to an end, not the end itself, see what we're building.
In production Kubernetes environments, this stack handles millions of metrics and gigabytes of logs daily. It’s what powers observability at companies that decided their cloud bills were getting ridiculous.
Init
What you need
Before diving in, ensure you have:
A running k3s cluster from the Hetzner Terraform setup
kubectlconfigured against your cluster with properkubeconfigfile[optional] a domain for access without
port-forward(strongly recommended)
How the Stack Fits Together
The observability pipeline flows in two parallel streams:
Metrics path: Prometheus scrapes /metrics endpoints from your pods and nodes every 15-30 seconds, stores time-series data locally, and exposes it to Grafana for dashboards and alerting rules.
Logs path: Alloy runs as a DaemonSet on every node, tails container logs from /var/log/pods, enriches them with Kubernetes metadata (namespace, pod name, labels), and ships them to Loki. Loki indexes only metadata—not log content—keeping storage costs low.
Grafana sits at the query layer, pulling from both Prometheus and Loki to correlate metrics spikes with log entries. When CPU hits 90%, you can jump directly to logs from that pod at that timestamp.

Apply
We’re deploying four Kubernetes resources: a namespace for isolation, then three HelmChart resources that leverage k3s’s built-in Helm controller. This approach means no local Helm CLI required—just apply the manifests and let k3s handle the rest.
Namespace
Every good monitoring stack deserves its own room. This namespace isolates all observability components from your application workloads.
namespace.yaml
apiVersion: v1
kind: Namespace
metadata:
  name: monitoring
  labels:
    name: monitoring
Nothing to edit here—monitoring is the conventional namespace name that other tools expect. Apply it:
kubectl apply -f namespace.yaml
Grafana + Prometheus Stack
The kube-prometheus-stack chart is an all-in-one deployment that bundles Prometheus, Grafana, Alertmanager, and a collection of pre-configured dashboards and alerting rules. This is where most of your configuration lives.
The serviceMonitorSelector settings below tell Prometheus to scrape all ServiceMonitors across all namespaces—not just those created by this Helm chart. Without this, your application metrics won’t be discovered.
prometheus-stack.yaml
apiVersion: helm.cattle.io/v1
kind: HelmChart
metadata:
  name: prometheus
  namespace: kube-system
spec:
  repo: https://prometheus-community.github.io/helm-charts
  chart: kube-prometheus-stack
  targetNamespace: monitoring
  createNamespace: true
  valuesContent: |-
    prometheus:
      prometheusSpec:
        resources:
          requests:
            cpu: "500m"
            memory: "1536Mi"
          limits:
            cpu: "2"
            memory: "3072Mi"
        retention: 15d
        retentionSize: "8GB"
        serviceMonitorSelectorNilUsesHelmValues: false
        serviceMonitorSelector: {}
        serviceMonitorNamespaceSelector: {}
        storageSpec:
          volumeClaimTemplate:
            metadata:
              labels:
                recurring-job.longhorn.io/source: enabled
            spec:
              storageClassName: longhorn  # <- edit if using different storage class
              accessModes: ["ReadWriteOnce"]
              resources:
                requests:
                  storage: 10Gi  # <- edit based on your retention needs

    grafana:
      adminPassword: ChangeMe123!  # <- EDIT THIS - but read the warning below
      resources:
        requests:
          cpu: "100m"
          memory: "512Mi"
        limits:
          cpu: "500m"
          memory: "1Gi"

      additionalDataSources:
        - name: Loki
          type: loki
          url: http://loki.monitoring.svc.cluster.local:3100
          access: proxy
          jsonData:
            tlsSkipVerify: true

      dashboardProviders:
        dashboardproviders.yaml:
          apiVersion: 1
          providers:
          - name: 'default'
            orgId: 1
            folder: ''
            type: file
            disableDeletion: false
            editable: true
            options:
              path: /var/lib/grafana/dashboards/default

      dashboards:
        default:
          loki-logs:
            gnetId: 15661
            revision: 1
            datasource: Prometheus

      grafana.ini:
        server:
          root_url: https://grafana.example.com  # <- edit with your domain
        dashboards:
          default_home_dashboard_path: /var/lib/grafana/dashboards/default/loki-logs.json

      persistence:
        enabled: true
        storageClassName: longhorn  # <- edit if using different storage class
        size: 2Gi
        labels:
          recurring-job.longhorn.io/source: enabled

    prometheus-node-exporter:
      resources:
        requests:
          cpu: "100m"
          memory: "64Mi"
        limits:
          cpu: "500m"
          memory: "256Mi"

      enabled: true
      hostRootFsMount:
        enabled: true
        mountPropagation: HostToContainer

      hostPID: true
      hostNetwork: false

      securityContext:
        runAsNonRoot: false
        runAsUser: 0
        seLinuxOptions:
          type: spc_t

      containerSecurityContext:
        allowPrivilegeEscalation: true
        readOnlyRootFilesystem: true
        capabilities:
          add:
            - SYS_TIME
          drop:
            - ALL

      extraArgs:
        - --collector.filesystem.mount-points-exclude=^/(dev|proc|sys|var/lib/docker/.+|var/lib/kubelet/.+)($|/)
        - --collector.filesystem.fs-types-exclude=^(autofs|binfmt_misc|bpf|cgroup2?|configfs|debugfs|devpts|devtmpfs|fusectl|hugetlbfs|iso9660|mqueue|nsfs|overlay|proc|procfs|pstore|rpc_pipefs|securityfs|selinuxfs|squashfs|sysfs|tracefs)$

    defaultRules:
      create: true
      rules:
        kubeControllerManager: false
        kubeProxy: false
        kubeSchedulerAlerting: false

    kubeProxy:
      enabled: false

    kubeControllerManager:
      enabled: false

    kubeScheduler:
      enabled: false
storageClassName: longhorn— change if you're using a different storage provisionerstorage: 10Gi— adjust based on cluster size and retention periodadminPassword: ChangeMe123!— this is the initial password only (more on this below)root_url: https://grafana.example.com— set your actual domain or remove if using port-forward
The node-exporter configuration looks aggressive with those runAsUser: 0 and privilege escalation settings. This is intentional—node-exporter needs deep access to host metrics that unprivileged containers cannot reach. The security context is scoped appropriately.
k3s doesn’t expose kube-controller-manager or kube-scheduler metrics the way kubeadm clusters do. The defaultRules section disables alerts that would otherwise fire constantly on non-existent endpoints. The disabled components (kubeProxy, kubeControllerManager, kubeScheduler) reflect k3s architecture, where these run as embedded processes rather than standalone pods. Enabling them would just generate scrape errors.
Alloy Log Collector
Alloy replaces the older Promtail agent for log collection. It gathers pod logs via the Kubernetes API and ships them to Loki with consistent labels for filtering.
alloy.yaml
apiVersion: helm.cattle.io/v1
kind: HelmChart
metadata:
  name: alloy
  namespace: kube-system
spec:
  repo: https://grafana.github.io/helm-charts
  chart: k8s-monitoring
  targetNamespace: monitoring
  createNamespace: true
  valuesContent: |-
    cluster:
      name: my-cluster  # <- edit: any name you want, purely cosmetic

    destinations:
      - name: loki
        type: loki
        url: http://loki-gateway/loki/api/v1/push

    clusterEvents:
      enabled: true
      collector: alloy-logs
      namespaces:
        - monitoring

    nodeLogs:
      enabled: false

    podLogs:
      enabled: true
      gatherMethod: kubernetesApi
      collector: alloy-logs

      labelsToKeep:
        - "app"
        - "app_kubernetes_io_name"
        - "container"
        - "instance"
        - "job"
        - "level"
        - "namespace"
        - "service_name"

      extraDiscoveryRules: |
        rule {
          source_labels = ["__meta_kubernetes_pod_label_app_kubernetes_io_name"]
          target_label  = "service_name"
        }
        rule {
          source_labels = ["__meta_kubernetes_pod_label_app"]
          regex         = "(.+)"
          target_label  = "service_name"
        }

    alloy-singleton:
      enabled: false

    alloy-metrics:
      enabled: false

    alloy-logs:
      enabled: true
      alloy:
        mounts:
          varlog: false
          dockercontainers: false
        clustering:
          enabled: true

    alloy-profiles:
      enabled: false

    alloy-receiver:
      enabled: false
name: my-cluster— purely a label, pick whatever identifies this cluster to you
The labelsToKeep array is curated to balance queryability with cardinality. High-cardinality labels (like pod UIDs) would explode Loki’s index size. The extraDiscoveryRules ensure your apps get a consistent service_name label regardless of whether they use app or app.kubernetes.io/name in their manifests.
Loki Log Storage
Loki stores logs in a cost-efficient way by only indexing metadata (labels), not log content. This single-binary deployment mode is perfect for small-to-medium clusters.
Loki’s query performance depends heavily on caching. The chunksCache and resultsCache sections below store recent chunks and query results in memory. The 512Mi allocation handles moderate query loads—increase if dashboards feel sluggish.
loki.yaml
apiVersion: helm.cattle.io/v1
kind: HelmChart
metadata:
  name: loki
  namespace: kube-system
spec:
  repo: https://grafana.github.io/helm-charts
  chart: loki
  targetNamespace: monitoring
  createNamespace: true
  valuesContent: |-
    loki:
      auth_enabled: false
      limits_config:
        volume_enabled: true
        allow_structured_metadata: true
        retention_period: 168h  # <- edit: 7 days default
      commonConfig:
        replication_factor: 1
      schemaConfig:
        configs:
        - from: "2024-04-01"
          store: tsdb
          object_store: filesystem
          schema: v13
          index:
            prefix: loki_index_
            period: 24h
      storage:
        type: filesystem
      compactor:
        working_directory: /var/loki/compactor
        compaction_interval: 10m
        retention_enabled: true
        retention_delete_delay: 2h
        retention_delete_worker_count: 150
        delete_request_store: filesystem

    singleBinary:
      replicas: 1
      persistence:
        enabled: true
        size: 5Gi  # <- edit based on log volume
        storageClass: longhorn  # <- edit if using different storage class

    backend:
      replicas: 0
    read:
      replicas: 0
    write:
      replicas: 0

    deploymentMode: SingleBinary

    chunksCache:
      enabled: true
      allocatedMemory: 512
      resources:
        requests:
          memory: 512Mi
          cpu: 100m
        limits:
          memory: 1Gi

    resultsCache:
      enabled: true
      allocatedMemory: 512
      resources:
        requests:
          memory: 512Mi
          cpu: 100m
        limits:
          memory: 1Gi

    monitoring:
      selfMonitoring:
        enabled: false
    lokiCanary:
      enabled: false
    test:
      enabled: false

    limits_config:
      volume_enabled: true
      ingestion_rate_mb: 50
      ingestion_burst_size_mb: 100
      retention_period: 720h  # <- edit: 30 days for outer limit
retention_period: 168h— how long logs are kept (7 days)size: 5Gi— persistent volume size for log storagestorageClass: longhorn— change if using different storage provisioner
The SingleBinary deployment mode bundles all Loki components into one pod. For larger clusters (50+ nodes, heavy log volume), you’d switch to the distributed mode with separate read/write/backend replicas. But for most self-hosted scenarios, single binary keeps resource usage reasonable.
SingleBinary Loki works well for clusters under 50 nodes ingesting less than 100GB/day of logs. Beyond that, you'll hit memory pressure and query timeouts.
Signs you've outgrown SingleBinary:
- Loki OOMKilled during large queries
- Dashboard queries timing out after 30s
- Ingestion lag visible in Alloy metrics
The upgrade path: Set deploymentMode: SimpleScalable and configure read, write, and backend replica counts. This separates ingestion from querying, letting you scale each independently. The config in this article is structured to make that transition straightforward—just uncomment the replica settings and set singleBinary.replicas: 0.
Deploy the Stack
Apply everything in order:
kubectl apply -f namespace.yaml
kubectl apply -f prometheus-stack.yaml
kubectl apply -f alloy.yaml
kubectl apply -f loki.yaml
Watch the pods come up:
kubectl get pods -n monitoring -w
The full stack takes 2-5 minutes to stabilize. Prometheus and Loki need to initialize their storage, and Grafana downloads dashboards from grafana.com on first boot.
Real-world Application
With everything deployed, you have a complete observability stack collecting metrics and logs. Now you need to actually see it.
Access via Port-Forward
The zero-configuration approach—no domain required, works immediately
kubectl port-forward -n monitoring svc/prometheus-grafana 3000:80
Open http://localhost:3000 in your browser
- Username:
admin - Password:
ChangeMe123!
Do not keep the provisioned password. Log in immediately and change it via Administration → Users → admin → Change password. The password in the HelmChart values is stored in plain text in your cluster's ConfigMaps. Anyone with cluster access can read it.
Access via Ingress (Recommended)
For production use, expose Grafana through a proper domain with TLS. If you followed the Setup Domain with HTTP TLS challange article with cert-manager and Cilium ingress, certificates will be automatically issued. Grafana include login process support plain username + password or other SSO techniques.
grafana-ingress.yaml
apiVersion: networking.k8s.io/v1
kind: Ingress
metadata:
  name: grafana-ingress
  namespace: monitoring
  annotations:
    cert-manager.io/cluster-issuer: letsencrypt-prod
    acme.cert-manager.io/http01-edit-in-place: "true"
    ingress.cilium.io/force-https: "true"
spec:
  ingressClassName: cilium
  tls:
  - hosts:
    - grafana.example.com  # <- edit with your domain
    secretName: grafana-kubegen-tls
  rules:
  - host: grafana.example.com  # <- edit with your domain
    http:
      paths:
      - path: /
        pathType: Prefix
        backend:
          service:
            name: prometheus-grafana
            port:
              number: 80
grafana.example.com— replace both occurrences with your actual subdomain
Apply, wait for the certificate (30~90sec) and access Grafana at https://grafana.your-domain.com
kubectl apply -f grafana-ingress.yaml
Navigating Grafana
Once logged in, three areas deserve your immediate attention:
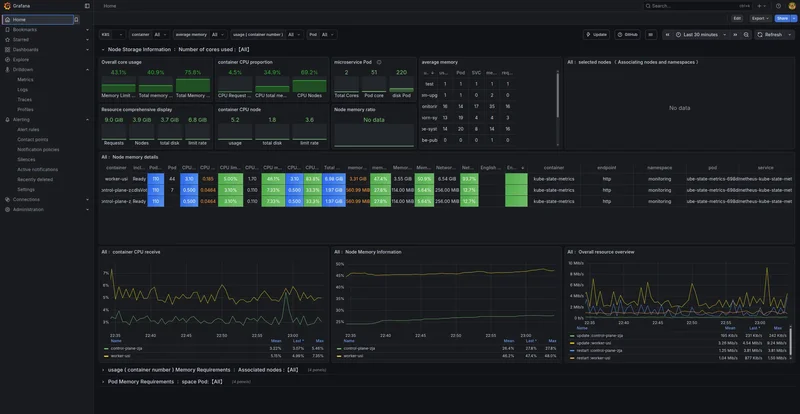
Home Dashboard
The home page displays the Loki Logs dashboard we configured as default. This shows node-level information including CPU, memory, disk utilization, and network I/O across your cluster. It’s the “is everything on fire?” view.
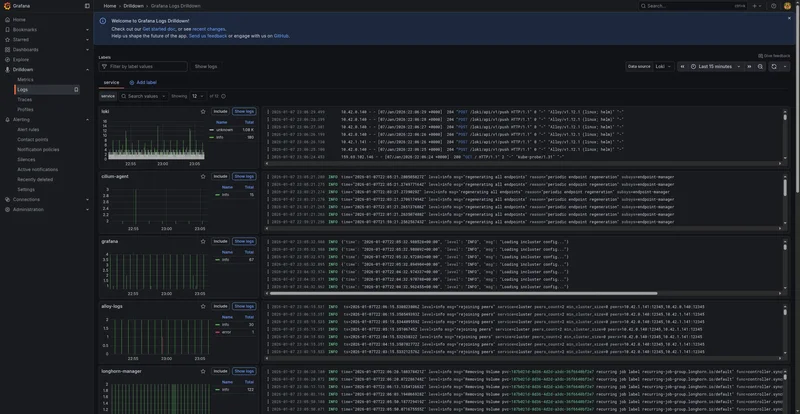
Drilldown → Logs
Navigate here to query logs from every application in your cluster through a unified interface. Loki’s LogQL query language lets you filter by namespace, pod, container, or any label.
All your application logs, in one place, with consistent labeling. Additionally you won’t lose your log anymore because a pod crashed. Everything persisted in K8s volumes.
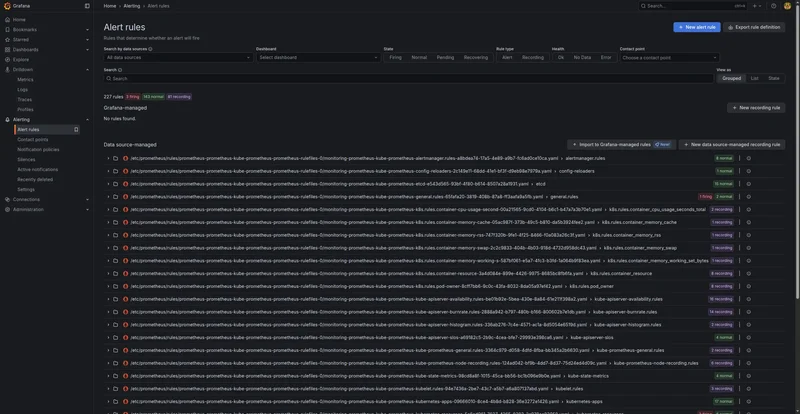
Alerting → Alert Rules
The kube-prometheus-stack ships with dozens of pre-configured alert rules covering node health, pod restarts, resource exhaustion, and Kubernetes component failures. These rules fire alerts when conditions match—high CPU for 15 minutes, pods in CrashLoopBackOff, nodes not ready.
You can add custom rules through the Grafana UI or by deploying PrometheusRule custom resources. The provisioned rules give you a production-grade starting point; tune thresholds based on your workload patterns.
You can easily setup a notify strategy too, so when specific alert fires, a message reach you and your team via mail, slack, telegram or wherever you want.
What this costs
Let’s talk money. Here’s the self-hosted stack versus managed alternatives for 1 month:
Solution | 1-Node Cluster | 10-Node Cluster | Log Ingestion (10GB/day) |
|---|---|---|---|
This stack | less then $1 (storage) | less then $1 (storage) | less then $3 (storage) |
Datadog | ~$18/host = $216 | $2160 | — |
New Relic | $0 (free tier) to $99/user | $25/100GB | $0.40/GB |
Grafana Cloud | $0 (free tier) | $19/host | $0.50/GB active series |
ZipOps | ~$15-30/mo | ~$15-30/mo | Pre-configured stack, we handle upgrades |
Grafana Cloud offers 10k metrics, 50GB logs, and 50GB traces free. New Relic gives 100GB/month free ingestion. For hobby projects or tiny clusters, these might suffice. The math changes when you're running production workloads with real retention requirements. That "free" tier disappears fast once you need more than 14 days of history or your log volume spikes during an incident.
The self-hosted stack’s cost is zero in licensing—you pay only for the compute and storage resources consumed on infrastructure you’re already renting. On a typical 3-node Hetzner cluster, the monitoring stack adds roughly $5~10/month in additional resource usage. Compare that to $200+ for managed services.
The hidden cost in self-hosted observability isn’t compute—it’s the 2 AM Prometheus OOM that takes down your alerting during an actual incident. ZipOps includes the same Grafana/Prometheus/Loki stack with managed upgrades and retention policies. Compare approaches →
The trade-off is maintenance responsibility. You upgrade Helm charts. You debug when Prometheus runs out of memory. You’re on-call for your own observability. For teams that value control and cost efficiency over operational convenience, this is the right trade.
What’s next
Congratulations! You now have a self-hosted Kubernetes cluster with proper DNS, automatic TLS certificates, and complete observability. Your monitoring system is watching your monitoring system. It’s turtles all the way down.
Where to go from here:
Deploy an actual application — All this infrastructure is lonely without workloads
Configure Alertmanager integrations — Route alerts to Slack, PagerDuty, or email
Setup domain with TLS — If you don’t have domain with TLS yet, this is the moment
Set up Grafana dashboards for your apps — Custom dashboards for application-specific metrics
The point
Following this article cost you approximately €0 in licensing and 30 minutes of configuration time. You now have enterprise-grade observability that would run $300-1000/month through managed providers.
In the DevOps landscape, this positions you to:
Debug production issues with correlated metrics and logs
Set up on-call alerting before users report outages
Satisfy compliance requirements with log retention and audit trails
Scale confidently knowing you’ll see resource exhaustion before it hits
The skills transfer directly to any Kubernetes environment. Whether you end up managing GKE clusters at a Fortune 500 or running your indie SaaS on bare metal, Prometheus and Grafana are the de facto standard.
Self-hosting observability is the pragmatic choice for teams that refuse to pay cloud tax on watching their own infrastructure. Now go deploy something worth monitoring.
This stack runs in production on ZipOps clusters. Same Hetzner/Cilium/Longhorn foundation, observability included. We handle the upgrades so you ship features. ZipOps
📬 Want more infrastructure deep-dives? Subscribe to our newsletter for guides on Kubernetes, self-hosting, and escaping cloud vendor lock-in. No spam, just infrastructure.